How Busy Engineers Can Reduce Datadog Costs with Actionable Tips
Feeling the pinch of rising Datadog expenses?
If you’re searching for effective Datadog cost optimization strategies, this guide is for you. It provides actionable tips to reduce Datadog costs by focusing on high-impact areas such as log management, APM (Application Performance Monitoring), and infrastructure hosts. By implementing these techniques, you can significantly cut Datadog expenses without sacrificing visibility or performance.
Start by Making Costs and Details Transparent Across Your Organization
I know you are busy — bring others on board to drive cost-saving initiatives.
Any roles except the Datadog Admin role can view usage but don’t have access to detailed cost data.** **Consider granting roles like Standard Role the ability to access Datadog billing details. Start by sharing the cost breakdown and insights with your teams.
You can request access to more detailed reports.
Further detailed usage reports can also be created on request by your account representative.
Use Usage Attribution for Detailed Insights
If you’re on an Enterprise plan, this feature is a powerful tool for enabling teams to investigate their own usage patterns independently.
Optimize Log Volume
Suppress Lambda START/END Logs
Lambda automatically generates START/END logs, but they provide minimal value. If you’re already using tracing, these logs are likely redundant. Excluding them can significantly reduce log volume, sometimes by more than half. This is effective whether you’re using Lambda Extensions or Datadog Forwarder for log transfer.
By suppressing logs on the client side, you can reduce subsequent ingestion processes downstream.
Avoid Indexing REPORT Logs
Lambda REPORT logs support enhanced metrics like duration calculations. However, once they’re ingested, they don’t need to be indexed. Consider excluding them from the log index to save costs, and also exclude them from the Sensitive Data Scanner for the same reason.
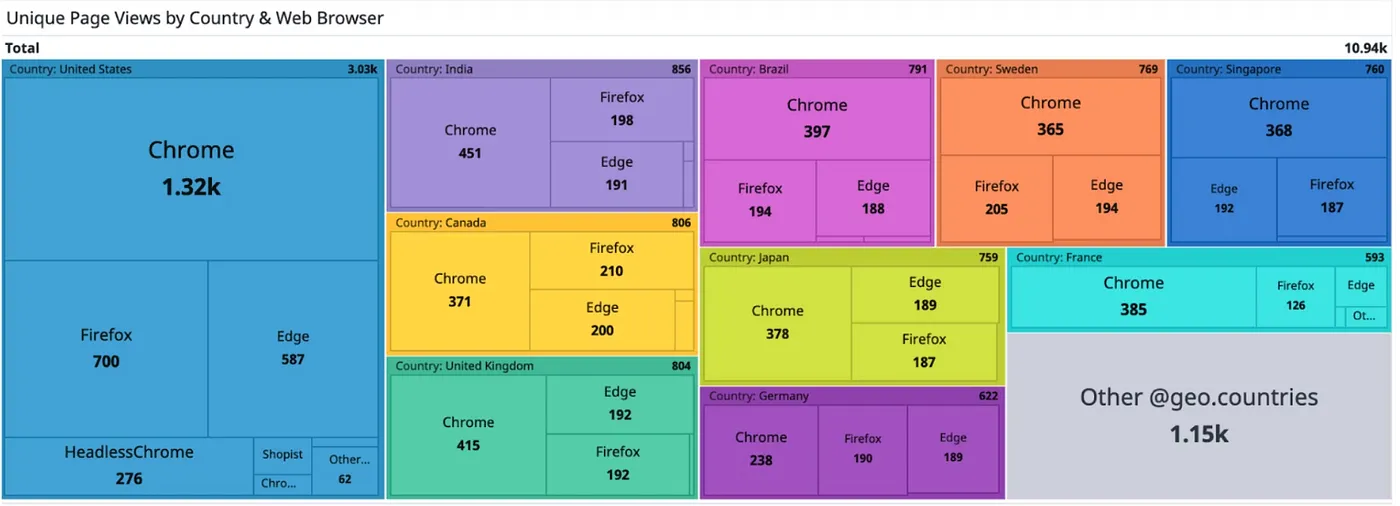
Use Tree Map Visualization to Analyze Log Volume
Leverage the Tree Map feature on the log screen to analyze log volume by category. You can group logs by multiple dimensions simultaneously, such as account, service, or host, for better insights.
Explore Log Volume Using Metrics
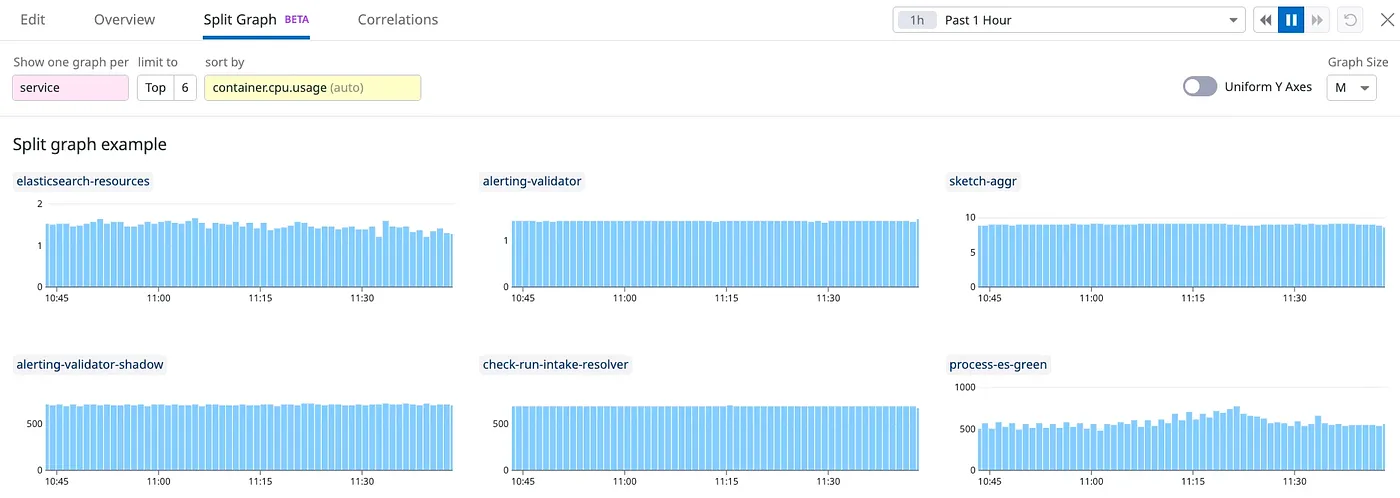
If you prefer metrics, the datadog.estimated_usage.logs.ingested_bytes metric can provide a clear visualization of log volume. A standout feature is Split Graphs, which allows you to break down graphs by category for better clarity and actionable insights.
Identify Unnecessary Log Patterns Using the Patterns Feature
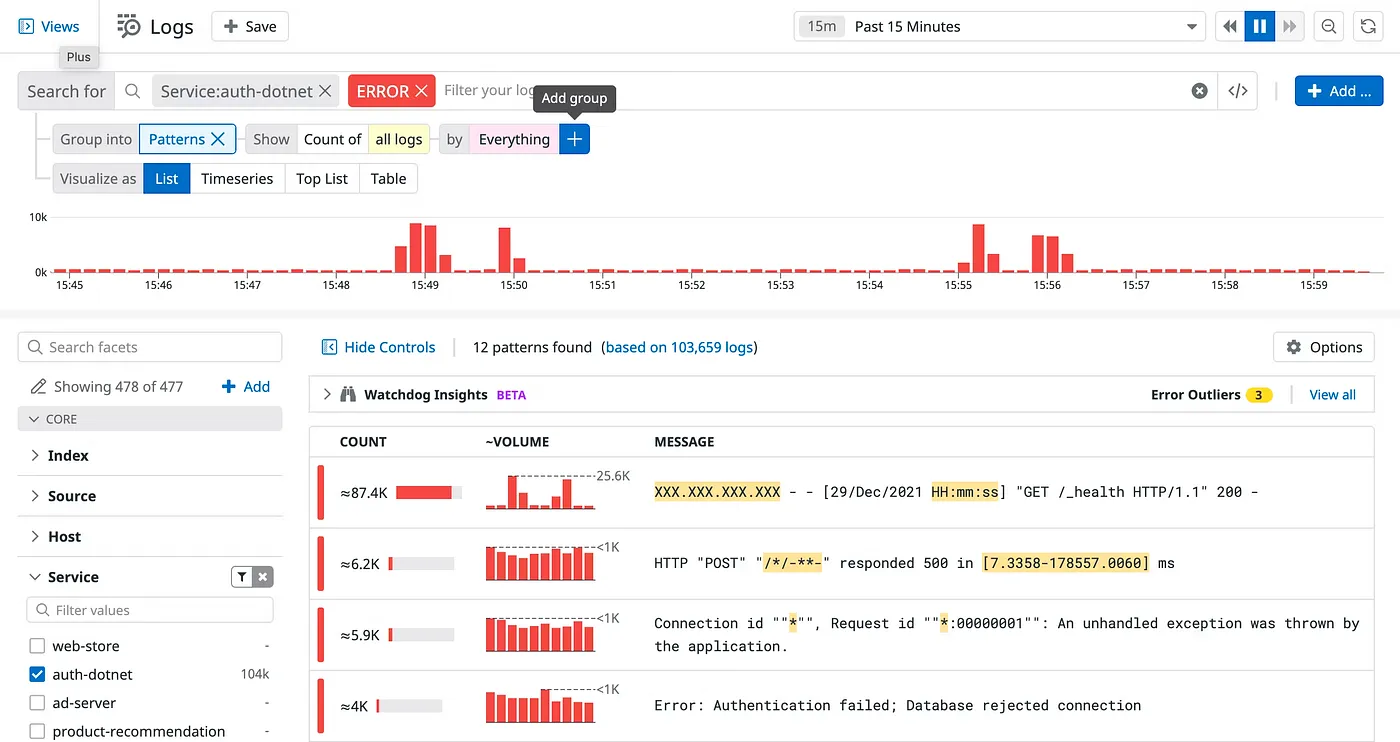
https://docs.datadoghq.com/logs/explorer/analytics/patterns/
The Patterns feature is often overlooked. Leverage it to pinpoint unnecessary or anomalous log patterns. To optimize costs, prioritize addressing high-volume logs that provide little value.
Filter Logs by Status
A high volume of WARN or ERROR logs is a red flag. Address these logs to clean up your system and potentially identify opportunities for application improvements.
Check for Duplicate Log Outputs
Occasionally, logs are outputted twice. This is often due to a misconfiguration in Datadog. Investigating and fixing this can save unnecessary costs.
Implement Log Sampling
For repetitive or low-value logs, consider implementing sampling.
Trim Your Logs
Use abbreviations and cut down on spaces or symbols.
e.g., mapping AccountID to aid
Framework-generated logs often have a lot of bloat — perfect for optimization.
Avoid Polling and Preflight Requests
Eliminate unnecessary calls by understanding the flow from frontend to backend.
Reducing transfer volume not only minimizes Datadog Forwarder execution costs but also significantly lowers cloud data transfer expenses.
Optimize APM
Apply the same approach as log management.
Start with Visualization
See the sections above for actionable insights.
Exclude Low-Impact Proxy Services
For stable services with minimal insights, exclude them from APM monitoring to optimize data collection and save on costs.
Sample Detailed Trace
Choose between sampling entire traces or targeting specific access points. With DD_TRACE_SAMPLING_RULES, for instance, you can apply sampling specifically to database access traces.
Identify and Eliminate Duplicate Traces
Duplicate trace outputs can occur due to configuration errors in Datadog. Regularly audit and resolve these issues to avoid redundant costs.
Fix N+1 Query Issues
Avoiding N+1 queries is essential, as they can severely affect both performance and reliability while also driving up Datadog costs due to the increased number of spans.
Optimize Infrastructure Hosts
Exclude Unmonitored Resources from AWS Integration
Even EC2 hosts without the Datadog Agent are billed if they’re part of AWS Integration. If monitoring all EC2 instances isn’t necessary, exclude them from the AWS Integration settings. For setups with CloudWatch Metric Streams, additional steps are required. Remove EC2 from the namespace on AWS to stop data from being sent to Datadog.
Additional Usage Optimization
Reduce API Test Frequency
API Test Billing is based on execution frequency, so running tests every minute costs 60 times more than hourly tests. In development environments, longer intervals are often sufficient. Adjust the frequency according to workload demands. Costs also scale with the number of locations. Limiting tests to a single region, such as Northern Virginia, can be an effective cost-saving measure. Dynamic interval adjustments based on time of day would be helpful, but this isn’t a built-in feature. You can implement such functionality using the Datadog API for custom configurations.
Optimize Sensitive Data Scanner
Lambda logs, such as START, END, and REPORT logs, typically don’t contain sensitive data. Exclude these logs from scanning to reduce unnecessary cost.
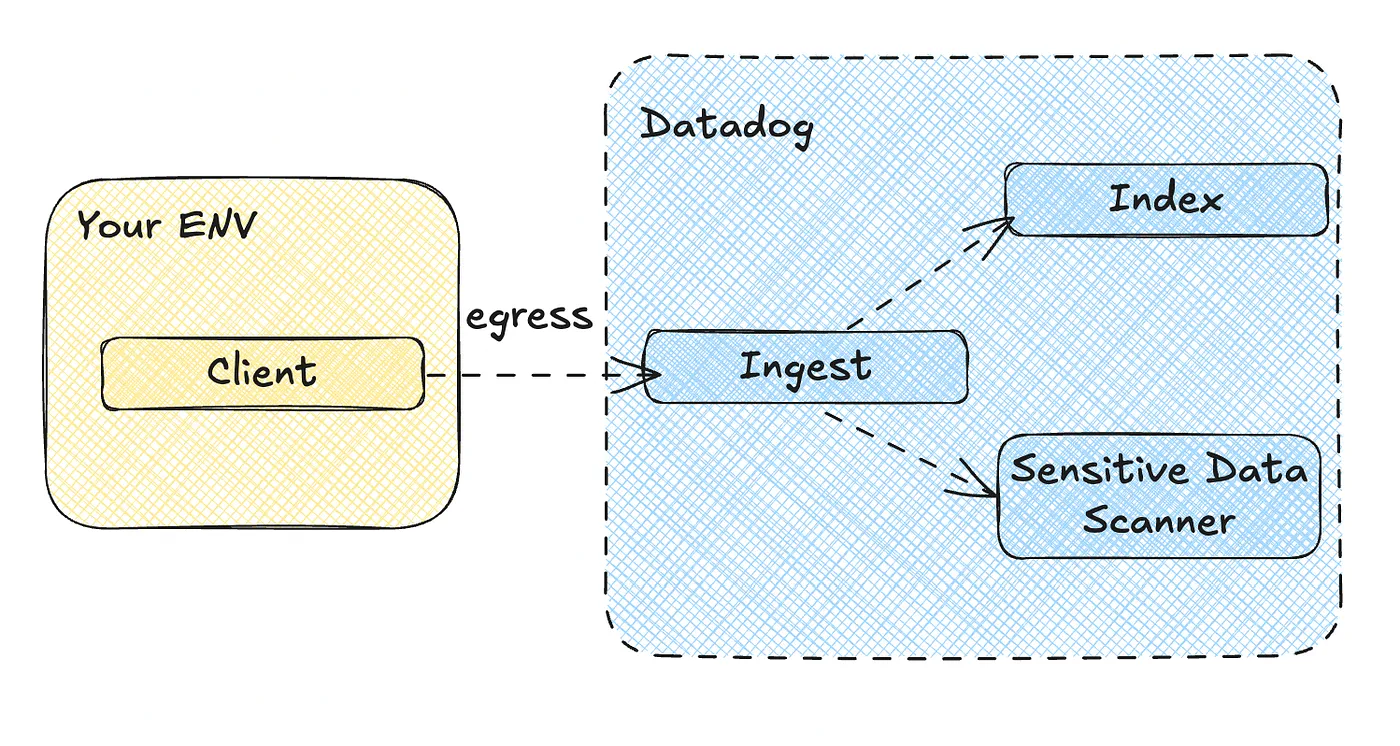
Indexing and Sensitive Data Scanner require separate filter settings. If you want to apply exclusions collectively, you’ll need to exclude them from being sent on the client side.
Turn Off RUM Session Replay to Cut Costs If You Don’t Need It
RUM Premium, with its Session Replay feature, comes at a higher price than standard RUM.
If Session Replay isn’t part of your workflow, double-check that sessionReplaySampleRate is set to 0 to avoid unnecessary costs.
Conclusion
Datadog costs are closely tied to cloud costs. Look for solutions that can address both areas simultaneously for maximum efficiency.
This article is the English version of the original article written in Japanese, availablehere.